
Skip to content
Scypion Finance
  • Articles
  • The Library
  • Glossary
  • Tools
  • Military
  • Videos
/
Scypion Finance

Data over opinion. Evidence over emotion.

YT𝕏∿

About

  • Company
  • Leadership
  • Contact
  • Editorial Standards

Legal

  • Terms of Use
  • Privacy Policy
  • Cookie Policy
  • Disclaimer

Scypion Finance is for educational and informational purposes only and is not financial, investment, tax, or legal advice. Reading this site does not create an advisory relationship. Markets carry risk; consult a licensed professional before acting on anything you read here.

Accessibility
© 2026 Scypion Finance. Founded by Erajah Scypion.Your money, and the forces that move it.

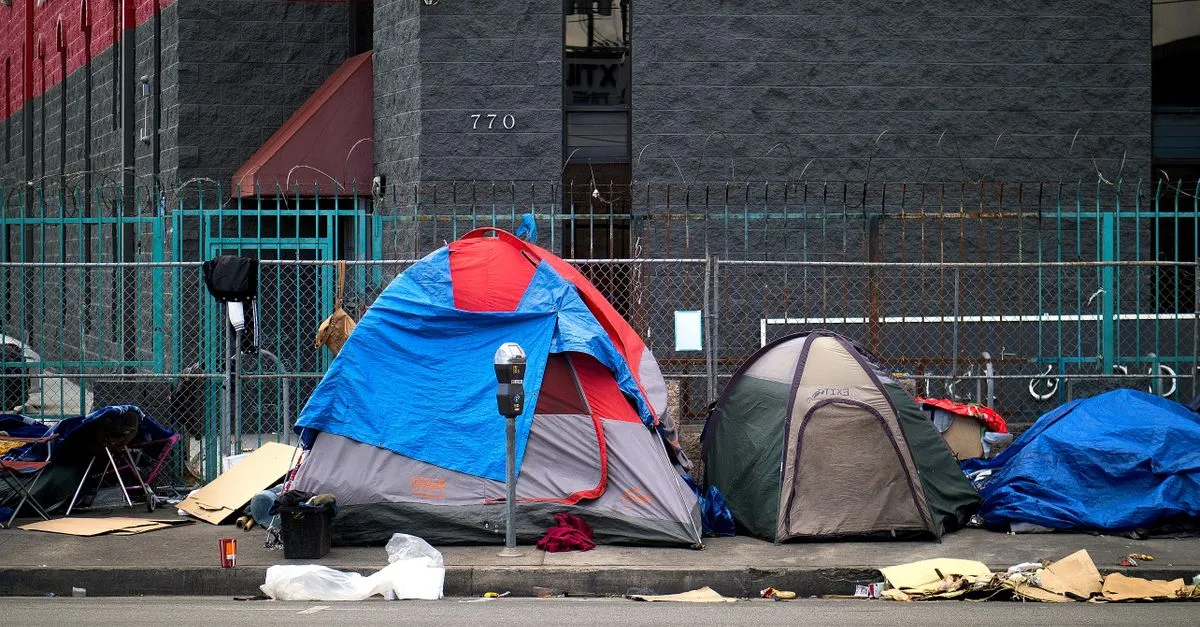
Photo by Milan Cobanov on Pexels

Home›The Economy›Global & Applied›Income & Inequality

Poverty Line: Defining the Threshold Between Poor and Not Poor

Erajah Scypion
Erajah ScypionFounder, Scypion Finance
5 sources4 min readPublished June 2, 2026
◆ Key Takeaways
  • Absolute poverty: a fixed income threshold (adjusted for inflation and family size) representing the minimum cost of basic needs
  • Relative poverty: a threshold defined as a percentage of median or mean income — typically 50-60% of median; it rises as the overall standard of living rises
  • The official U.S. poverty line is an absolute measure with roots in a 1960s formula based on food costs; critics argue it understates true deprivation in a modern economy
  • The Supplemental Poverty Measure (SPM) is a more comprehensive alternative that counts in-kind transfers and accounts for regional cost differences
On this page
  • In plain terms
  • Why it works this way
  • A real example
  • Why it matters

In 2024, the official U.S. poverty line for a family of four was approximately $31,200 per year. A family earning $31,199 is officially poor; a family earning $31,201 is not. Both realities are nearly identical, but the binary classification determines eligibility for dozens of federal programs. The threshold was originally designed in the 1960s by Social Security Administration economist Mollie Orshansky, who based it on the observation that poor families spent about a third of their income on food — so she multiplied the minimum adequate food budget by three. That formula, updated only for general inflation since then, still determines who counts as poor in official U.S. statistics. Whether that 60-year-old method still accurately captures the modern experience of material deprivation is one of the most consequential measurement questions in social policy.

In plain terms

A poverty line (also called a poverty threshold) is an income level below which a household or individual is classified as living in poverty. It defines the minimum income necessary to meet basic needs — and thus serves as the official cutoff for poverty statistics and program eligibility.

Absolute poverty: a fixed standard representing the income needed to purchase a specific basket of necessities. The official U.S. poverty threshold is an absolute measure — it does not change as average living standards rise, only as prices do (CPI adjustment). The Census Bureau's official poverty statistics use this measure: roughly 11–13 percent of the U.S. population falls below it in any given year.

Relative poverty: a threshold defined relative to the overall income distribution — typically 50 or 60 percent of the median income. As the median rises (the general standard of living improves), the poverty line rises with it. Most European countries use relative measures, which is why their official poverty rates don't fall as fast during growth periods as absolute poverty rates do: people are poor relative to peers, not just relative to a fixed basket.

Why it works this way

The U.S. absolute measure was innovative in 1964 but has attracted increasing criticism:

Underinclusion: the threshold doesn't account for regional cost differences (housing is vastly more expensive in San Francisco than in rural Mississippi), and doesn't include major non-food expenses like healthcare, childcare, and transportation that are proportionally larger in modern budgets.

Overcounting (and undercounting) income: the official measure counts cash income but ignores in-kind benefits (SNAP, Medicaid, housing vouchers) that materially improve living standards, overstating poverty among transfer recipients. It also misses the Earned Income Tax Credit.

The Supplemental Poverty Measure (SPM), introduced by the Census Bureau in 2011, addresses these issues: it counts in-kind benefits, accounts for taxes and tax credits, and uses a consumption-based threshold updated to modern spending patterns. The Census Bureau's SPM data shows substantially different poverty rates than the official measure — particularly showing that government programs reduce poverty far more than the official measure captures.

A real example

The COVID-19 pandemic period illustrated the measurement gap dramatically. The Census Bureau's data showed official poverty rates barely moving in 2020 despite massive economic disruption — because cash income was replaced by stimulus payments and enhanced unemployment benefits that the official measure captures. The SPM showed poverty rates reaching historic lows in 2021 as expanded transfers (Child Tax Credit, stimulus payments) were included in the broader income measure.

Why it matters

The poverty line is the administrative linchpin of dozens of federal programs — Medicaid, SNAP, housing assistance, CHIP, and others. The measurement choice directly determines who receives help and what official progress against poverty looks like. Choosing an absolute threshold makes it easier to achieve "progress" (fewer people below a fixed bar) even as relative deprivation persists; choosing a relative threshold keeps the definition of poverty tied to societal living standards and makes it harder to claim progress through nominal income growth alone.


◆ THE GUIDEThe Best Economics Books for Non-EconomistsThe best economics books for people who never took the class — accessible guides from Wheelan and Sowell, plus Freakonomics and the source texts from Smith and Friedman.See our picks →

◆ Sources

  1. Poverty Statistics — U.S. Census Bureau
  2. Supplemental Poverty Measure — U.S. Census Bureau
  3. HHS Poverty Guidelines — U.S. Department of Health and Human Services
  4. Poverty Line — Investopedia
  5. Poverty — Library of Economics and Liberty
On this page
  • In plain terms
  • Why it works this way
  • A real example
  • Why it matters
◆ Related reading
  • Social Mobility: The Ability to Move Up (or Down) the Economic Ladder
  • Should the Government Redistribute Income? The Economics of Taxes, Transfers, and Trade-Offs
  • Progressive vs. Regressive Tax: How the Burden Changes With Income
  • The Gini Coefficient and the Lorenz Curve: Measuring Inequality in a Single Number
All Income & Inequality →
◆ SHARE
Erajah Scypion
Erajah Scypion
Founder, Scypion Finance

I got interested in economics the hard way, by not understanding what was happening around me. I'd read an explanation, nod along, and walk away knowing no more than when I started. After enough of that, I stopped looking for the resource I wanted and started writing it. My background isn't Wall Street. I've spent the last eleven years in the U.S. Navy, and that's where I learned the thing this whole site runs on: Any system — a battalion, a budget, an economy — can be understood if someone walks you through it one step at a time. The Navy also gave me the three words I hold the work to: honor, courage, commitment. Here they mean every claim traces back to a source you can check yourself, the clear explanation gets chosen over the easy one, and the reader comes before anyone paying the bills. Scypion Finance is where that work gets published: sourced explanations of money and the economy, written to be understood. Start wherever your question is.

View full profile →

More in Income & Inequality

All Income & Inequality →
◆ GOVERNMENT INTERVENTION

Equity vs. Efficiency: Two Goals That Often Conflict

Economic equity is the fairness or justice of economic outcomes and processes. Efficiency maximizes total value; equity addresses its distribution.

3 min read
Read →
◆ INCOME & INEQUALITY

Transfer Payment: Income Without a Corresponding Production Requirement

A transfer payment is a government payment to an individual not in exchange for a good or service.

3 min read
Read →
◆ INCOME & INEQUALITY

How Income Is Distributed in the United States

The top fifth of U.S. households takes about half of all income; the bottom fifth gets roughly 3%. What Census data shows, and what it leaves out.

7 min read
Read →
◆ INCOME & INEQUALITY

Income Distribution: How a Country's Income Is Divided

Income distribution describes how total national income is divided among households and individuals.

3 min read
Read →

◆ THE NEWSLETTER

Money, made clear

Personal finance and the economy, broken down: numbers shown, every claim sourced.

Only when it's worth your time. No spam, unsubscribe anytime.