
The 1970s became catastrophic not because of oil shocks alone, but because inflation expectations came unanchored: workers and businesses expected perpetual price increases, building a self-sustaining wage-price spiral. Volcker broke it by driving rates to 20 percent, at the cost of 10.8 percent unemployment. Today's 4.2 percent energy-driven spike lacks that one critical ingredient.
On this page
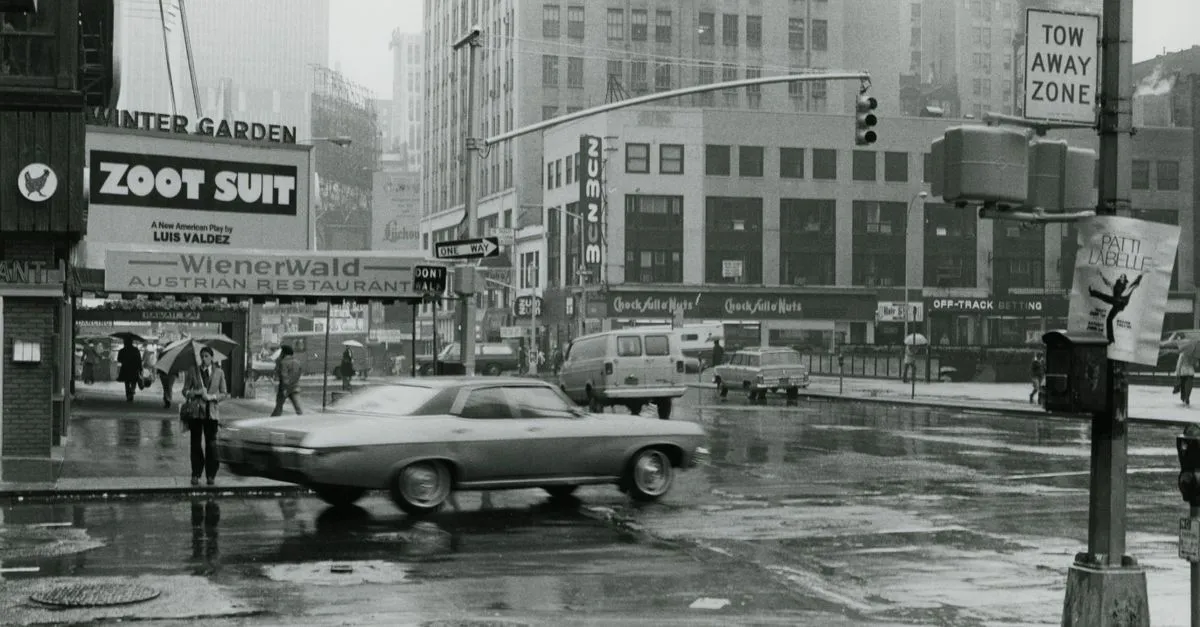
In the summer of 1979, drivers in California waited in lines that wrapped around the block to buy gasoline they might not get. Some states rationed by license plate: odd numbers one day, even the next. Tempers flared into fistfights at the pump. A second oil shock, triggered by the revolution in Iran3, had hit a country already worn down by nearly a decade of rising prices. And the worst of the inflation was still ahead.
What the United States lived through in those years had a name economists had half-convinced themselves was impossible: stagflation, a stagnant economy, high unemployment, and high inflation, all at the same time. The textbooks said you got one or the other. You got rising prices in a hot economy, or unemployment in a cold one, not both at once. The 1970s tore that comfortable rule in half.
This is the story of how bad it got, what it finally took to break it, and why that history matters right now, in June 2026, with gasoline prices surging again on tension in the same part of the world. The point isn't to scare you. It's to show you exactly which ingredients turned a 1970s oil shock into a decade of misery, so you can see for yourself which of those ingredients are present today and which aren't. I'll define the terms as we go.
How inflation got entrenched
Inflation didn't arrive in the '70s as one event. It built. The decade opened with the U.S. already running loose: heavy government spending, a Federal Reserve reluctant to cause pain, and a widespread belief that a little inflation was a fair price for low unemployment.
Then came the shocks. In 1973, an Arab oil embargo quadrupled the price of crude almost overnight. In 1979, the Iranian Revolution sent it soaring again. Energy runs through everything (shipping, manufacturing, the cost of getting to work), so when oil spikes, prices rise across the whole economy.
But here is the part that made the '70s the '70s. People stopped treating high inflation as temporary and started expecting it. Workers demanded raises to keep up with prices they assumed would keep climbing. Businesses raised prices to cover those wages. Each fed the other (economists call it a wage-price spiral) and inflation became self-sustaining, unhooked from any single oil shock. By March 1980, consumer prices were rising 14.8 percent year over year1: a dollar was losing nearly a seventh of its value every twelve months.
That phrase, inflation expectations coming unanchored, is the hinge of the whole story. Keep it in mind, because it's the exact thing that separates then from now.
The cure was brutal on purpose
In August 1979, President Carter appointed Paul Volcker to chair the Federal Reserve. Volcker had concluded something his predecessors had flinched from: you could not coax this inflation down gently. You had to break it, and breaking it would hurt.
His tool was the federal funds rate, the interest rate the Fed steers, which ripples out to the cost of every loan in the country. When Volcker took office it sat around 11 percent. He drove it up relentlessly, and by mid-1981 it touched roughly 20 percent4. Mortgages crossed 18 percent. Borrowing nearly stopped. The economy, starved of cheap money, buckled.
That was the plan. The recession of 1981 to 1982 was, in large part, deliberately induced: the Fed choosing a sharp, known pain over an open-ended one. The cost was enormous: unemployment climbed to 10.8 percent by late 19822, the highest since the Great Depression to that point. Factories closed. Farms failed. Millions lost jobs.
And it worked. Inflation fell from 13.5 percent in 1980 to 3.2 percent by 1983, more than ten percentage points wrung out in three years. Volcker had proven that a determined central bank could kill entrenched inflation. He'd also shown the world the size of the bill. That trade (a deep recession now to end inflation that would otherwise grind on for years) is the central lesson of the era, and it's why every Fed chair since has treated unanchored expectations as the thing to prevent at all costs.
Why June 2026 rhymes, but isn't a repeat
Now look at today, because the echo is real. In May 2026, headline inflation jumped to 4.2 percent, driven hard by energy: gasoline alone was up more than 40 percent over the year6, pushed by tension around Iran. An oil-linked price spike, out of the same region, lifting the numbers Americans feel most at the pump and the grocery store. If you only read that sentence, 2026 sounds like 1979 starting over.
It isn't, and the reasons are specific. Hold the two eras side by side.
The depth is different. In 1980, inflation was 14.8 percent and had been in double digits for years. In 2026, headline inflation is 4.2 percent, and the underlying core rate (which strips out volatile food and energy to show the trend) sits near 2.9 percent.5 The 2026 spike is concentrated in energy, not spread through the whole economy.
Expectations are still anchored. This is the big one. In the '70s, Americans came to expect permanent high inflation and acted on it, igniting the wage-price spiral. Today, after decades of low and stable prices, households and markets still expect inflation to return to normal. No entrenched spiral has taken hold. The single ingredient that turned a 1970s oil shock into a decade of stagflation is the one most clearly missing now.
The Fed is already credible and already tight. Volcker had to build the Fed's anti-inflation credibility from nothing, at ruinous cost. Today's Fed inherited it, and as of June 2026 it's holding its rate at a restrictive 3.50 to 3.75 percent, leaning against inflation rather than scrambling to catch up. It doesn't need to engineer a 1982-scale recession because it never let expectations slip in the first place.
So the rhyme is genuine: an energy shock from the same region, lifting the prices people feel most. But a rhyme isn't a repeat. The 1970s didn't become the 1970s because of one oil shock; they became the 1970s because the country let high inflation become normal in people's minds, and then had to pay 10.8 percent unemployment to undo it. That's the part history is warning about, and so far, it's the part that hasn't happened.
What the gas lines actually teach
The lesson of the 1970s isn't "an oil shock means doom." Oil shocks come and go. The lesson is narrower and more useful: inflation becomes catastrophic when people stop believing it's temporary, and the cost of restoring that belief, once it's lost, is measured in lost jobs and lost years. The drivers in those 1979 gas lines weren't just paying for expensive fuel. They were paying for a decade of letting inflation run until no one trusted the dollar to hold its value. Watch June 2026's energy spike for what it is. Then watch the one number that would actually signal history repeating: not the price of gas, but whether anyone still believes it'll come back down.
◆ Frequently Asked Questions
What made the 1970s stagflation different from a normal recession?
What is a wage-price spiral, and why is it so hard to stop?
How did Volcker stop the inflation, and what did it cost?
Why isn't the 2026 energy spike likely to repeat the 1970s outcome?
◆ Sources
- The Great Inflation (peak 14.8% in March 1980; the entrenchment) — Federal Reserve History
- Recession of 1981-82 (Volcker's break; unemployment reached 10.8%) — Federal Reserve History
- Oil Shock of 1978-79 (the Iranian Revolution, gas lines, the second energy spike) — Federal Reserve History
- Effective Federal Funds Rate (FEDFUNDS), showing the ~20% Volcker peak — FRED, St. Louis Fed
- Consumer Price Index for All Urban Consumers: All Items (CPIAUCSL), the historical inflation series — FRED, St. Louis Fed
- Consumer Price Index Summary — May 2026 (today's energy-driven 4.2% headline, gasoline +40.5%) — U.S. Bureau of Labor Statistics