
Skip to content
Scypion Finance
  • Articles
  • The Library
  • Glossary
  • Tools
  • Military
  • Videos
/
Scypion Finance

Data over opinion. Evidence over emotion.

YT𝕏∿

About

  • Company
  • Leadership
  • Contact
  • Editorial Standards

Legal

  • Terms of Use
  • Privacy Policy
  • Cookie Policy
  • Disclaimer

Scypion Finance is for educational and informational purposes only and is not financial, investment, tax, or legal advice. Reading this site does not create an advisory relationship. Markets carry risk; consult a licensed professional before acting on anything you read here.

Accessibility
© 2026 Scypion Finance. Founded by Erajah Scypion.Your money, and the forces that move it.

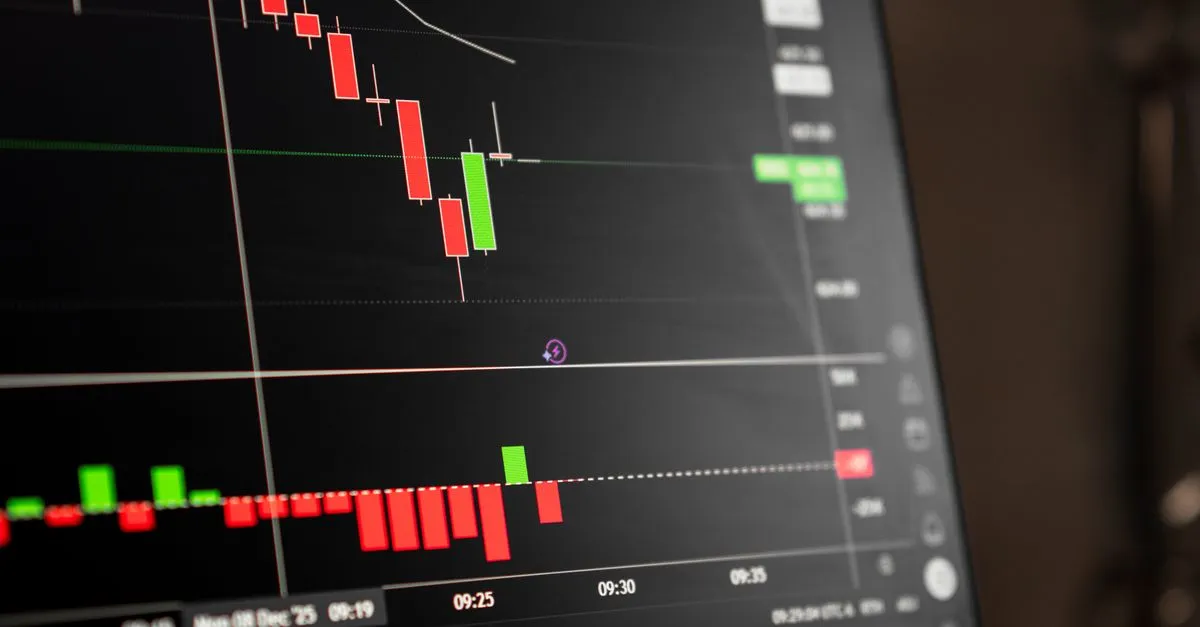
Photo by Alex Luna on Pexels

Home›The Economy›How Money Works›Market Fundamentals

What Is a Bear Market?

Erajah Scypion
Erajah ScypionFounder, Scypion Finance
1 source4 min readPublished June 2, 2026
◆ Key Takeaways
  • Bear market is officially defined as stock index prices down 20%+ from recent peak
  • Bear markets are normal; the S&P 500 experiences one roughly every 3-5 years on average
  • Psychologically, bear markets feel like crashes even when returns are moderate; 'it will never recover' feelings emerge
  • Worst bear markets include 2008 (-57%), 2000-2002 (-49%), and 1973-1974 (-48%)
  • Investing during bear markets (buying low) produces the best long-term returns; selling during bear markets produces the worst
On this page
  • Bear Market Definition
  • Bear Market Triggers
  • Historical Bear Markets
  • Duration and Frequency
  • Psychology of Bear Markets
  • Bear Markets and Recoveries
  • Key Statistics
  • Opportunity in Bear Markets
  • Bear Market Mistakes
  • How to Navigate Bear Markets
  • Bear Market Definitions (Beyond 20%)
  • The Bottom Line

A bear market is a period when stock prices fall 20% or more from recent highs, typically accompanied by pessimism and declining investor confidence.

Bear Market Definition

Official trigger: Index down 20% from peak

Example: S&P 500 at 4,800 (peak) → falls to 3,840 (down 20%) = bear market

Once the index falls 20%, it's officially a bear market. Some indexes are in bear markets while others aren't (small-cap stocks might be down 30% while large-caps are down 15%).

Bear Market Triggers

Economic recession: Weak growth, rising unemployment

Federal Reserve tightening: Raising rates to fight inflation

Financial crisis: Bank failures, credit market disruption Valuation reset: Stock prices were too high; they fall to reasonable levels

Geopolitical shock: War, political instability

Historical Bear Markets

2008 financial crisis:

  • Decline: -57%
  • Duration: 17 months
  • Recovery: 4+ years

2000-2002 dot-com crash:

  • Decline: -49% (S&P 500)
  • Duration: 30 months
  • Recovery: 5 years

1973-1974 energy crisis:

  • Decline: -48%
  • Duration: 21 months
  • Recovery: 7 years

2022 inflation/rate hikes:

  • Decline: -19.6% (just below bear market)
  • Duration: 9 months
  • Recovery: 1 year

2020 COVID:

  • Decline: -34% (fastest to bear market)
  • Duration: 1 month
  • Recovery: 5 months (fastest recovery)

Duration and Frequency

Since 1950, the S&P 500 experiences a bear market (20%+ decline) roughly every 3-5 years on average.

Average bear market: 14-16 months

Worst bear markets (decline >30%): Roughly every 10-15 years

Catastrophic bear markets (decline >50%): Roughly every 30-50 years

Psychology of Bear Markets

Bear markets are psychologically brutal even when they're moderate:

Narrative: "This is different; the market will never recover"

Reality: The market always recovers (eventually)

But it doesn't feel that way during the bear market. Media coverage is relentlessly negative. Pessimism is everywhere. Selling begets more selling (negative feedback loop).

Bear Markets and Recoveries

Crucial insight: The stock market has recovered from every bear market and gone on to new all-time highs.

1987 crash: S&P 500 down 34% in one month. By 1989, new all-time high.

2000-2002: Down 49%. By 2007, new all-time high.

2008: Down 57%. By 2013, new all-time high.

2020: Down 34%. By 2021, new all-time high.

Patterns: Recoveries take 2-5 years (except 2020's unprecedented 5-month recovery).

Key Statistics

Average bear market decline: -35% Median duration: 14 months Average time to recovery: 3-4 years Frequency: About every 3-5 years

Opportunity in Bear Markets

Bear markets create buying opportunities:

Example: Investor with $100,000

Bull market (2017-2021):

  • Portfolio grows to $170,000
  • But no buying opportunities

Bear market (2022):

  • Indexes down 20%
  • New money (salary, bonus) buys at 20% discount
  • $10,000 invested buys shares worth future $12,500 (20% discount to full recovery)

The math:

  • Investors who panic sold in 2008 at -57% and missed recovery: Lost 57% and missed 300%+ subsequent gains
  • Investors who held and bought in 2008: Captured 300%+ gains from 2009-2021

Difference: Hundreds of thousands of dollars.

Bear Market Mistakes

1. Panic selling: Selling at the bottom is the worst possible timing

2. Missing the recovery: Staying out of the market after exiting misses the biggest gains (usually come first few months of recovery)

3. Market timing: Trying to sell before bears and buy at the bottom is nearly impossible

4. Abandoning strategy: Changing allocation during bear markets locks in losses

How to Navigate Bear Markets

1. Maintain allocation: Don't panic and sell. Stay invested.

2. Dollar-cost average: Continue regular contributions. Buy more at lower prices.

3. Rebalance: Sell bonds (up) and buy stocks (down). This mechanically forces buying low.

4. Focus on long-term: Bear markets are temporary. If your horizon is 20+ years, declines are irrelevant.

5. Ignore headlines: Media is most negative during bear markets (when pessimism is highest). Ignore the noise.

Bear Market Definitions (Beyond 20%)

Correction: Down 10-20% Bear market: Down 20%+ Crash: Rapid sharp decline (often single day or week) Secular bear: Long bear market lasting years (2000-2012 is considered a secular bear with two major bear cycles)

The Bottom Line

Bear markets are inevitable and recurring. They feel catastrophic but historically last 12-18 months. The stock market has recovered from every bear market on record and gone on to new highs.

The best investment strategy during bear markets: maintain your allocation, continue investing, and remember that declines are buying opportunities for long-term investors.

◆ THE GUIDEThe Best Economics Books for Non-EconomistsThe best economics books for people who never took the class — accessible guides from Wheelan and Sowell, plus Freakonomics and the source texts from Smith and Friedman.See our picks →

◆ Sources

  1. Bear Market Explained — Investopedia
On this page
  • Bear Market Definition
  • Bear Market Triggers
  • Historical Bear Markets
  • Duration and Frequency
  • Psychology of Bear Markets
  • Bear Markets and Recoveries
  • Key Statistics
  • Opportunity in Bear Markets
  • Bear Market Mistakes
  • How to Navigate Bear Markets
  • Bear Market Definitions (Beyond 20%)
  • The Bottom Line
◆ Related reading
  • How Markets Find Their Price: Solving for Equilibrium
  • What Is Market Capitalization?
  • What Is a Treasury Bond?
  • What Is Short Selling?
All Market Fundamentals →
◆ SHARE
Erajah Scypion
Erajah Scypion
Founder, Scypion Finance

I got interested in economics the hard way, by not understanding what was happening around me. I'd read an explanation, nod along, and walk away knowing no more than when I started. After enough of that, I stopped looking for the resource I wanted and started writing it. My background isn't Wall Street. I've spent the last eleven years in the U.S. Navy, and that's where I learned the thing this whole site runs on: Any system — a battalion, a budget, an economy — can be understood if someone walks you through it one step at a time. The Navy also gave me the three words I hold the work to: honor, courage, commitment. Here they mean every claim traces back to a source you can check yourself, the clear explanation gets chosen over the easy one, and the reader comes before anyone paying the bills. Scypion Finance is where that work gets published: sourced explanations of money and the economy, written to be understood. Start wherever your question is.

View full profile →

More in Market Fundamentals

All Market Fundamentals →
◆ MARKET FUNDAMENTALS

What Is an IPO?

Initial Public Offering—when a private company becomes public by selling shares to the public. The first day of trading.

4 min read
Read →
◆ MARKET FUNDAMENTALS

What Is P/E Ratio?

Price-to-Earnings Ratio—the price of a stock divided by annual earnings per share. A key valuation metric.

5 min read
Read →
◆ MARKET FUNDAMENTALS

What Is the S&P 500?

An index of the 500 largest U.S. companies, used as a benchmark for the overall U.S. stock market.

5 min read
Read →
◆ SUPPLY & DEMAND

How Prices Carry Information: The Coordination System No One Designed

Prices do more than report costs — they aggregate dispersed knowledge and coordinate millions of strangers without a central director.

9 min read
Read →

◆ THE NEWSLETTER

Money, made clear

Personal finance and the economy, broken down: numbers shown, every claim sourced.

Only when it's worth your time. No spam, unsubscribe anytime.